Posts

Showing posts with the label Performance

December, 2020 Performance Flash

Image
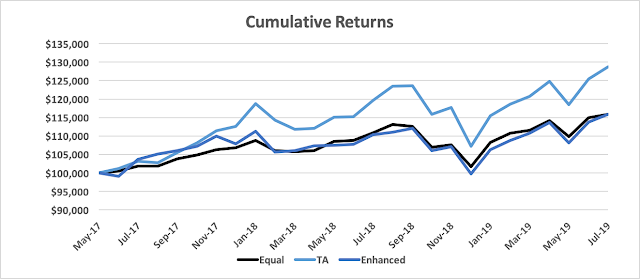
Long overdue performance update. Markets have been going strong based mostly on Government stimulus.  While this makes me very nervous, my model says things look good and so it has been adding risk  Performance Charts: Cumulative Returns show the Enhanced portfolio made some strong gains in November and is close to matching the TA portfolio in the long run. Recent returns have strongly favored the Enhanced portfolio as all of its picks have outperformed over the past 3 months.

Catch Up - Sept Trades, Oct Allocation and Trades 2020

Image
 I apologize for not posting for awhile.  Below is some information in brief form to catch up: Market Overview: These markets are very strange.  It seems that recently the only thing one needs to monitor is how much stimulus the Government is providing.  If it is increasing then you want to be in equities, if it is decreasing you want to be in bonds. I do not believe this is healthy nor sustainable and it causes deep concern for me. Update on performance:  The enhanced portfolio continues to do well in recent months. Sept 1st Trades: Equal Weight Portfolio: No Trades in this portfolio TA Portfolio: Cash balance prior to trade $347.29 Sold  103 shares of  AGG  at $118.24 with $0.22 SEC Fee. Total proceeds $12,178.50 Bought 99 shares of  VTWO  at $126.26 with $0 commission. Total cost $12,499.74 Ending cash balance of $26.05 Enhanced TA Portfolio: Cash balance prior to trade $466.62 Sold 87 shares of AGG   at $118.24 with $0.21 SEC Fe...

July Flash Performance

Image
YTD 2020 through June we have seen a sharp decline followed by a steep reversal. This year has been a perfect example of why you want to stay  fully invested and not trade based on emotions. If you pulled out of the market when everyone was scared (as COVID became reality in March) you would have sold at low prices and missed a huge rally.  By staying invested and being disciplined about the type of risk you are taking, which is what my approach does, it has allowed us to weather the storm and generate solid returns without taking on inordinate risk. It is nice to see the Enhanced portfolio starting to produce better results. Early results were hit by a bet on international equities and the US did much better. The recent positioning in low quality bonds has been quite beneficial. June performance of the holdings in the various portfolios from the highest to lowest return: HIX 7.2%, DSL 6.7%, IEMG 5.7%, VTWO 4.1%, VONE 1.6%, AGG 0.5%, GOVT 0.0%, JNK -0.8%. ...

May 2020, Performance Flash

Image
YTD 2020 through May we have seen a sharp decline followed by a steep reversal. The big question on everyones mind is whether we have seen the worst of this downturn or not.  The answer to that is not simple.  The huge stimulus announced by the Federal Reserve is fighting against the very difficult economic backdrop of shelter in place.  There are clear winners and losers in this scenario but are these changes permanent or will things go back to normal at some point?  These are all difficult questions. I am happy to be seeing that my model continues to work in these unique times. The key is to not ever take risk off the table but just change the type of risk.  Over the past 12 months VTWO  (small cap equity) has lost 4.70% while VONE  (large cap equity) has gained 10.44%. This is typical during times of turbulence - people flee to larger companies that they feel more secure in. I moved into the very low risk AGG  (high quality bonds) for ...

2020 Q1 Performance

Image
In Q1 2020, COVID 19 hit the world and the markets. The lack of small cap stocks was very beneficial in the TA and Enhanced portfolio's.  The portfolio's have lower risk in them than the equal weighted portfolio and this was demonstrated in this quarters returns.  During the quarter, the four asset class returns were  VONE -20.50%, VTWO -30.75%, JNK -13.08%, AGG 3.04%. Over the past 12 months returns were  VONE -9.73%, VTWO -25.03%, JNK -7.19%, AGG 8.82% Small cap stocks ( VTWO ) tend to do poorly at the end of the market cycle and during a crash. After we move through the bottom of this cycle we will begin adding them back into our portfolio as they are usually the stars during a rebound.  We added high yield ( JNK ) this month as the yields are very beneficial when equity markets are low and they tend to rebound very quickly when the market begins to heal. Performance as of March 31, 2020 was: Blog Basics: In this ...

2019 FY Performance

Image
In 2019, the markets rebounded after a large selloff in Q4 of 2018.  Market strength has continued despite many concerned voices about high valuations. In the  TA portfolio , the decision to focus on large cap stocks was very beneficial in 2019.  Of the four options,  VONE  was the top performer gaining 31.12%. The small cap  VTWO  was next advancing 25.81%. Lower quality bonds  JNK  were up 14.88% and investment grade bonds AGG returned 8.46%. In the  Enhanced portfolio , we replaced AGG with  GOVT  which returned 7.36% and underperformed AGG  by 1.1%. A small portion of  VONE  was replaced with   DVY  and  IEMG  both of which detracted from returns.   DVY  returned 22.62% and  IEMG  returned 17.79%.  Both great returns but far behind  VONE . The earlier inversion of the yield curve, the high levels of corporate debt, and the euphoric rise and fal...

2019 - Q3 Performance

Image
In the third quarter we have continued to see prices increase, however the pace has slowed. In the TA portfolio , the decision to focus on large cap stocks was very beneficial in Q3.  VONE was up 0.98% while the small cap VTWO was down 2.61%.  Investment grade bonds were the top performer during the quarter returning 1.63%. Lower quality bonds JNK were down 0.18%. It is typical in the late cycle of an economic expansion for large cap stocks to continue performing while small cap show early signs of market stress. In the Enhanced portfolio ,  GOVT returned 1.96% which outperformed the AGG by 0.33.  DVY returned 2.4% which outperformed VONE by 1.42%. Both of these contributed to the Enhanced portfolios strong results. Emerging markets continued to suffer and IEMG lost 4.70% which trailed VONE by 5.68%. Right now the poor performance of small cap stocks and low quality bonds in recent months is a strong signal to increase safety in the portfolio. Stati...

July, 31 2019 Performance

Image
Performance as of June 31st was:            July         1 Yr        3 Yrs      ITD    Equal           0.87%        4.55%         -na-     7.35%     TA           2.53%        7.52 %         -na-    13.23%    Enhanced           1.78%        4.92%         -na-     7.32%    Blog Basics: In this blog I share and discuss three portfolios. The first is a "buy and hold" strategy that does not ever change. I call this the  Equal  portfolio because it is made up of four equal parts allocated to different asset classes. It is 1/4 in Large Cap Equity (Ticker  VONE ), 1/4 in Small Cap Equity (Ticker...

2019 - Q2 Peer Review

Peer Relative Performance  in the second quarter was solid. Markets continued to rebound and my tactical portfolio's were relatively aggressive. The one year numbers are particularly good and have been steadily above 80th percentile. The following is a review of all of the  Morningstar  monitored tactical asset allocation funds relative to my three funds. Return percentiles as of June 30, 2019. The % tells where the fund ranks during that period (100% would be the top performing fund, 0% would be the bottom)              3 Mo              1 Yr             3 Yrs      5 Yrs     Equal              67%              83%           -na-      -na-      TA              88%    ...

2019 - Q2 Track Record

Historic Track Record Report Card: A record of all of the completed positions I have taken in the TA and Enhanced portfolios. One year performance at month end for each month in the Second Quarter (Q2): April:  VONE (13.2%) ,   JNK (7.0%) ,   AGG(5.4%),  VTWO (4.5%)   May:  AGG(6.7%),  JNK (5.2%) ,   VONE (3.3%) ,  VTWO (-9.2%)   June:  VONE (9.9%) ,   JNK (8.4%) ,   AGG(7.7%),  VTWO (-3.6%)   TA:   Position taken one year ago: April:  VONE     Rank:   1st May: VONE     Rank:   3rd June: VONE       Rank: 1st History 1st 2nd 3rd 4th Number of Bets:    4  7   3  0  % of Bets:   29%  50%   21%  0 % Enhanced:  Position taken one year ago: April: KXI (2.3%)      Rank:   - Negative May:   VONE (3.3%) Rank: = Neutral June:   IEMG (0.7%) Rank: ...

2019 - Q2 Performance

Image
The first half of they year has seen a great rebound after a very difficult 4th quarter of 2018.  In the short term there has been a lot of concern over the China trade war and protectionism eating into corporate profitability. However we also see our President doing everything he can to bolster the economy (even trying to fire the Federal Reserve Chair). I believe his view is that if the economy is strong, he will get re-elected. So I am bullish for at least a year or so. My signals are close to taking things more conservative but they are kind of hovering so I am not too concerned that they are going to change soon. Looking back at the last 12 months of performance the AGG is actually the best performer right now. Performance as of June 31st was:          3 Mo         1 Yr        3 Yrs      ITD    Equal           3.07%       ...

February 2019 Track Record

Image
Historic Track Record Report Card: A record of all of the completed positions I have taken in the TA and Enhanced portfolios. One year performance as of February 28th (in order):   VTWO (5.5%),    VONE (4.9%) ,   JNK (4.3%) ,   AGG(3.1%) . TA:   Position taken one year ago:  VONE Rank:   2nd History 1st 2nd 3rd 4th Number of Bets:   2  6  2  0  % of Bets:   20%  60%   20%  0 % Enhanced:  Position taken one year ago:  DBCMX (-3.2%) Rank :  - Negative History     +   =   - Number of Bets:     3   1   6 % of Bets:   30%  10%  60% PORTFOLIO UPDATE (as of 3/08/2019): Current Performance: The ETF's and other funds that make up the portfolio's MTD Returns: Ticker 3/8/19 VONE -1.6% VTWO -3.4% JNK -0.7% AGG 0.2% DVY -0.9% IEMG -1.8% KXI 0.2% JXI GOVT 0.6% 0.4% Co lor signi...

January 2019 Review

Image
January saw a nice rebound after the fourth quarter (Q4) drop. In looking back at Q4, there was an oddity. Equity moved before debt. Typically debt holders get uncomfortable with companies and reduce prices before equity holders. Debt holders are looking at a companies ability to generate enough cash to pay the coupon for the next few years. This longer term focus (relative to equities which tend to focus on the next quarter's earnings) means they usually spot trouble first. Traders are blaming systematic trading (computer generated) as the cause of the Q4 downturn. The culprit is that most computer trading algorithms include a momentum factor as part of their decision making process. This means that the more stocks go up, the more they buy and the more stocks go down, the more they sell. This can create self sustaining moves both to the up and down side. These moves can also get started without any fundamental catalyst, like an economic downturn. This is important to be awa...