How Does Dollar Cost Averaging Work?
Dollar cost averaging simply means that you buy the same dollar amount of a security at regular intervals.
Example: You buy $1000 of Tesla stock every Friday for a year.
Why do it? This is easiest to highlight with a real life example.
You buy $1000 of Tesla stock every Friday for 52 weeks.
You start on January 5, 2018 when the price was 316.58
You end on January 4, 2019 when the price was 316.13
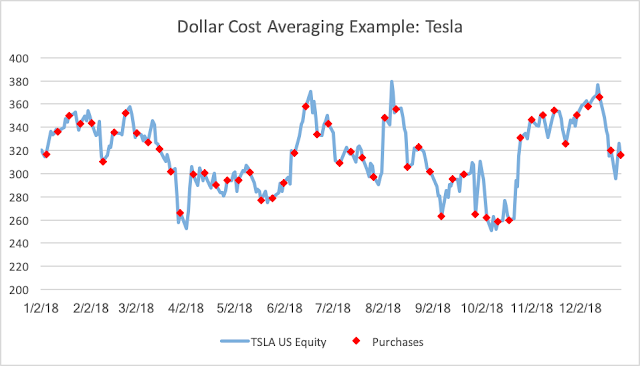
Was this a profitable investment strategy? If you had bought on 1/5/18 and sold on 1/4/19 you would have had a small loss because the price was slightly lower. However because of Dollar Cost Averaging we actually made $560 and had an internal rate of return (IRR) of 2.2%.
How is this possible? By holding the dollar amount invested constant we bought more shares when the price was low and less shares when it was high.
Example: On February 2nd, when the stock price was $343.75 we only bought 2.91 shares of stock but on October 12th, when the price was $258.78 we bought 3.86 shares. Over time this lowers the cost of our purchases. The average price that we purchased at was $315.59 but if you weight that by the amount of shares purchased you get an average purchase price of $312.76.
Summary: Sorry for all the math. Basically Dollar cost averaging gets us more exposure when the price is low and less exposure when the price is high (buy low sell high). It is a good way to lower the overall costs of investing. If you regularly put money into your retirement savings you are probably already benefiting from dollar cost averaging without even knowing it.
If you want to see the details of the trades that make up my example scroll to the very bottom of the page.
PORTFOLIO UPDATE (as of 3/15/2019):
 Current Performance:
The ETF's and other funds that make up the portfolio's MTD Returns:
Portfolio Description:
The first is a "buy and hold" strategy that does not ever change. I call this the Equal portfolio because it is made up of four equal parts allocated to different asset classes. It is 1/4 in large cap equity (Ticker VONE), 1/4 in small cap equity (Ticker VTWO), 1/4 in investment grade debt (Ticker AGG), and 1/4 in high yield debt (Ticker JNK). The allocations never change. The only thing needed is to rebalance every so often as performance differences will cause the weights to shift.
The second portfolio is a "tactical" portfolio. It is tactical because it adjusts the weights to the four asset classes above based on market conditions. I call this the TA portfolio. It can go 100% into any one asset class or be a mixture of them. 1/12th of this portfolio can change each month as I make a monthly call on what i expect will do best over the next year based on current market conditions. Historically I have picked the best asset class about 50% of the time, the second best about 25% of the time, the third best 18% of the time and the worst 7% of the time.
The third portfolio is also a "tactical" portfolio. I call it the Enhanced portfolio because I follow the same allocation as the TA portfolio but I pick other vehicles that I expect to offer a better return than the four ETF's used in the Equal portfolio. This allows for active management and broader exposure to asset classes such as International Equities, Emerging Markets, and Commodities among others.
Current Allocations:

Purchase Details:
Example: You buy $1000 of Tesla stock every Friday for a year.
Why do it? This is easiest to highlight with a real life example.
You buy $1000 of Tesla stock every Friday for 52 weeks.
You start on January 5, 2018 when the price was 316.58
You end on January 4, 2019 when the price was 316.13

Was this a profitable investment strategy? If you had bought on 1/5/18 and sold on 1/4/19 you would have had a small loss because the price was slightly lower. However because of Dollar Cost Averaging we actually made $560 and had an internal rate of return (IRR) of 2.2%.
How is this possible? By holding the dollar amount invested constant we bought more shares when the price was low and less shares when it was high.
Example: On February 2nd, when the stock price was $343.75 we only bought 2.91 shares of stock but on October 12th, when the price was $258.78 we bought 3.86 shares. Over time this lowers the cost of our purchases. The average price that we purchased at was $315.59 but if you weight that by the amount of shares purchased you get an average purchase price of $312.76.
Summary: Sorry for all the math. Basically Dollar cost averaging gets us more exposure when the price is low and less exposure when the price is high (buy low sell high). It is a good way to lower the overall costs of investing. If you regularly put money into your retirement savings you are probably already benefiting from dollar cost averaging without even knowing it.
If you want to see the details of the trades that make up my example scroll to the very bottom of the page.
PORTFOLIO UPDATE (as of 3/15/2019):

The ETF's and other funds that make up the portfolio's MTD Returns:
| Ticker | 3/15/19 |
| VONE | 1.2% |
| VTWO | -1.4% |
| JNK | 0.0% |
| AGG | 0.6% |
DVY | 1.1% |
| IEMG | 1.6% |
| KXI | 2.5% |
| JXI GOVT | 2.5% 0.5% |
Portfolio Description:
The first is a "buy and hold" strategy that does not ever change. I call this the Equal portfolio because it is made up of four equal parts allocated to different asset classes. It is 1/4 in large cap equity (Ticker VONE), 1/4 in small cap equity (Ticker VTWO), 1/4 in investment grade debt (Ticker AGG), and 1/4 in high yield debt (Ticker JNK). The allocations never change. The only thing needed is to rebalance every so often as performance differences will cause the weights to shift.
The second portfolio is a "tactical" portfolio. It is tactical because it adjusts the weights to the four asset classes above based on market conditions. I call this the TA portfolio. It can go 100% into any one asset class or be a mixture of them. 1/12th of this portfolio can change each month as I make a monthly call on what i expect will do best over the next year based on current market conditions. Historically I have picked the best asset class about 50% of the time, the second best about 25% of the time, the third best 18% of the time and the worst 7% of the time.
The third portfolio is also a "tactical" portfolio. I call it the Enhanced portfolio because I follow the same allocation as the TA portfolio but I pick other vehicles that I expect to offer a better return than the four ETF's used in the Equal portfolio. This allows for active management and broader exposure to asset classes such as International Equities, Emerging Markets, and Commodities among others.
Current Allocations:

DISCLAIMER:
Past performance is not a guarantee of future performance. This strategy is presented for informational purposes only and is not a solicitation to buy or sell any securities. The writer of this blog owns many (long positions only), if not all, of the securities discussed in this blog. October is one of the peculiarly dangerous months to speculate in stocks in. The others are July, January, September, April, November, May , March, June, December, August and February. ~ Mark Twain
Purchase Details:
| Date | Price | Shares Bought | Cost |
| 1/5/18 | 316.58 | 3.16 | $1,000 |
| 1/12/18 | 336.22 | 2.97 | $1,000 |
| 1/19/18 | 350.02 | 2.86 | $1,000 |
| 1/26/18 | 342.85 | 2.92 | $1,000 |
| 2/2/18 | 343.75 | 2.91 | $1,000 |
| 2/9/18 | 310.42 | 3.22 | $1,000 |
| 2/16/18 | 335.49 | 2.98 | $1,000 |
| 2/23/18 | 352.05 | 2.84 | $1,000 |
| 3/2/18 | 335.12 | 2.98 | $1,000 |
| 3/9/18 | 327.17 | 3.06 | $1,000 |
| 3/16/18 | 321.35 | 3.11 | $1,000 |
| 3/23/18 | 301.54 | 3.32 | $1,000 |
| 3/29/18 | 266.13 | 3.76 | $1,000 |
| 4/6/18 | 299.30 | 3.34 | $1,000 |
| 4/13/18 | 300.34 | 3.33 | $1,000 |
| 4/20/18 | 290.24 | 3.45 | $1,000 |
| 4/27/18 | 294.08 | 3.40 | $1,000 |
| 5/4/18 | 294.09 | 3.40 | $1,000 |
| 5/11/18 | 301.06 | 3.32 | $1,000 |
| 5/18/18 | 276.82 | 3.61 | $1,000 |
| 5/25/18 | 278.85 | 3.59 | $1,000 |
| 6/1/18 | 291.82 | 3.43 | $1,000 |
| 6/8/18 | 317.66 | 3.15 | $1,000 |
| 6/15/18 | 358.17 | 2.79 | $1,000 |
| 6/22/18 | 333.63 | 3.00 | $1,000 |
| 6/29/18 | 342.95 | 2.92 | $1,000 |
| 7/6/18 | 308.90 | 3.24 | $1,000 |
| 7/13/18 | 318.87 | 3.14 | $1,000 |
| 7/20/18 | 313.58 | 3.19 | $1,000 |
| 7/27/18 | 297.18 | 3.36 | $1,000 |
| 8/3/18 | 348.17 | 2.87 | $1,000 |
| 8/10/18 | 355.49 | 2.81 | $1,000 |
| 8/17/18 | 305.50 | 3.27 | $1,000 |
| 8/24/18 | 322.82 | 3.10 | $1,000 |
| 8/31/18 | 301.66 | 3.31 | $1,000 |
| 9/7/18 | 263.24 | 3.80 | $1,000 |
| 9/14/18 | 295.20 | 3.39 | $1,000 |
| 9/21/18 | 299.10 | 3.34 | $1,000 |
| 9/28/18 | 264.77 | 3.78 | $1,000 |
| 10/5/18 | 261.95 | 3.82 | $1,000 |
| 10/12/18 | 258.78 | 3.86 | $1,000 |
| 10/19/18 | 260.00 | 3.85 | $1,000 |
| 10/26/18 | 330.90 | 3.02 | $1,000 |
| 11/2/18 | 346.41 | 2.89 | $1,000 |
| 11/9/18 | 350.51 | 2.85 | $1,000 |
| 11/16/18 | 354.31 | 2.82 | $1,000 |
| 11/23/18 | 325.83 | 3.07 | $1,000 |
| 11/30/18 | 350.48 | 2.85 | $1,000 |
| 12/7/18 | 357.97 | 2.79 | $1,000 |
| 12/14/18 | 365.71 | 2.73 | $1,000 |
| 12/21/18 | 319.77 | 3.13 | $1,000 |
| 12/27/18 | 316.13 | 3.16 | $1,000 |
| Totals | 166.26 | $52,000 | |
| Current Value | =316.13*166.26 | $52,560 | |
| Profit | $560 | ||
| Price change | =316.13-316.58 | $(0.45) | |


Comments
Post a Comment