The Retirement Question
I have had many people ask me the very difficult question:
Without a crystal ball, there is no way to know the exact answer. So like most things, the answer is, "it depends". There are so many unknown's (how long will you live, how will your spending habits change, what will your investment returns look like, what will inflation do)? But there are also some things that we control and those are what I would like to analyze together.
To do this, we will look at the retirement related decisions we make and their impact on retirement age (holding all the unknowable things constant). We will find that decreasing spending is more powerful than increasing income, being too conservative with investments has a high cost in terms of retirement age and that time is a critical factor (get started early).
So lets start by talking setting the stage for our analysis.
Retirement Planning Phases:
There are basically two phases that we will call Accumulation and Retirement:
Accumulation: During this phase we are working to generate income. Ideally, we are earning more than we are spending and our excess earnings go into savings (if you spend more than you earn, then you have negative earnings aka debt). I find it helpful to compare savings to a bathtub, the water is the money, the earnings are the water pouring into the tub and the spending is the water going down the drain. The only way for water to accumulate in the tub is if water is going into the tub faster than it can exit. In mathematical terms it looks like:
Before we get to the graphs, let’s talk about the things we can influence.
Income: In the short term, it is hard to increase this. We can take on more hours or a second job but there is a limited amount of time in each day. In the longer term, we can train ourselves to qualify for promotions or to change jobs. The main problem with increasing income is that we also tend to increase our spending almost inline with income. If we do this the impact on savings is very small. Additionally, we are now acclimated to a more expensive life style which means we will spend more in retirement and will therefore need a bigger pool of savings to support our retirement.
Spending: This impacts both of the phases we discussed earlier and is one of the most powerful ways to improve your retirement outlook. Lowering your spending allows the savings pool to grow faster during accumulation and lowers the outflow during retirement. Unfortunately, our society encourages us to spend to the max. Resisting this siren song is difficult but will have a powerful impact.
Timing: This probably has the biggest impact on our retirement outlook. How long do we save for? We can lengthen this time by starting earlier, working later into life or both. Next months informational blog post will focus on the impact and cost of postponing your retirement savings in detail.
Investment Earnings: We don’t directly control the returns we get on our investments (savings) but we do control the amount of risk in our investments (savings). Generally, over time, higher risk results in higher returns. It is crucial that we stay the course, which can be hard in times of stress but not taking enough risk can also be costly. Overly conservative returns may be more secure (less prone to negative results) but they usually are not enough to achieve a desirable outcome.
Analysis:
In order to better understand the impact of the retirement decisions we make, I created a model where we can input a base case scenario and record the results. Then we adjust one thing at a time and see how much it influences the results.
Below is the output of my model. The inputs and the optional sections are things we can adjust, the derived section gives us important outputs and the graph gives us a view of our expected savings pool balance over time (given the parameters). The base case will be an annual income of $100,000, spending of $90,000 (so a savings of $10,000) and earnings on investment of 5%. The savings plan starts at age 25 and needs to fund spending until the person is 101. In this base case they can retire at age 68 and will have just over $1.4 million when they retire. The chart shows how their balance increases and decreases and hits 0 at about age 101. Notice how the curvature changes before and after retirement, this is from the impact of investment returns.

Now that we have a base case, let’s make some adjustments. We will start with the earnings by increasing it by $20,000 (but holding spending constant). This allows us to retire at age 52 which saves us 16 years of work (very nice!).


Something interesting to note in the last two graphs is how the slope of the graphs differ after the retirement date (on the right hand portion of the graphs). By saving a bit longer than needed the accumulated funds go down much slower. This is because our investment returns are larger (due to the larger pool of assets) and offset more of the spending each year. The flatter this line is the more flexibility you will have to handle negative events in your post retirement life.
Conclusions:
To conclude I will sum up all the graphs and numbers into a couple of simple statements.
I would love to hear your thoughts and feedback. If you would like a copy of the spreadsheet I created for this post (so you can put your own numbers in) e-mail a request to btbagg@gmail.com.
Most people are looking for an age but underlying this question is a dollar amount. What we really want to know is "When can I retire and live comfortably for the rest of my life without financial worries?". The answer to this has just as much to do with your retirement savings as it does with your age.When can I retire?
Without a crystal ball, there is no way to know the exact answer. So like most things, the answer is, "it depends". There are so many unknown's (how long will you live, how will your spending habits change, what will your investment returns look like, what will inflation do)? But there are also some things that we control and those are what I would like to analyze together.
To do this, we will look at the retirement related decisions we make and their impact on retirement age (holding all the unknowable things constant). We will find that decreasing spending is more powerful than increasing income, being too conservative with investments has a high cost in terms of retirement age and that time is a critical factor (get started early).
So lets start by talking setting the stage for our analysis.
Retirement Planning Phases:
There are basically two phases that we will call Accumulation and Retirement:
Accumulation: During this phase we are working to generate income. Ideally, we are earning more than we are spending and our excess earnings go into savings (if you spend more than you earn, then you have negative earnings aka debt). I find it helpful to compare savings to a bathtub, the water is the money, the earnings are the water pouring into the tub and the spending is the water going down the drain. The only way for water to accumulate in the tub is if water is going into the tub faster than it can exit. In mathematical terms it looks like:
Income - Spending = SavingsRetirement: In this phase, we no longer work or generate significant income. We live off of the savings we have created during the accumulation phase. There is still some increase (returns on our investments) but for most people it is less than they are spending. Using the tub analogy again, you now have a full tub (hopefully) and the same amount of water going down the drain but you now only have a trickle going into the tub (all coming from investment earnings and social security, etc.). The tub needs to be full enough to last longer than you do (sorry there is no easy way to say that). In mathematical terms this looks like:
Beginning Savings - Spending + Earnings On Savings = Ending SavingsDuring these two phases you have your savings pool (the accumulated water) which will ideally be growing during the ‘Accumulation’ phase and will probably be shrinking during the ‘Retirement’ phase. Where this analogy breaks down is that the savings generates its own income and the bigger the savings the bigger the income. This is very powerful and causes the curvature in the graphs below.
Before we get to the graphs, let’s talk about the things we can influence.
Income: In the short term, it is hard to increase this. We can take on more hours or a second job but there is a limited amount of time in each day. In the longer term, we can train ourselves to qualify for promotions or to change jobs. The main problem with increasing income is that we also tend to increase our spending almost inline with income. If we do this the impact on savings is very small. Additionally, we are now acclimated to a more expensive life style which means we will spend more in retirement and will therefore need a bigger pool of savings to support our retirement.
Spending: This impacts both of the phases we discussed earlier and is one of the most powerful ways to improve your retirement outlook. Lowering your spending allows the savings pool to grow faster during accumulation and lowers the outflow during retirement. Unfortunately, our society encourages us to spend to the max. Resisting this siren song is difficult but will have a powerful impact.
Timing: This probably has the biggest impact on our retirement outlook. How long do we save for? We can lengthen this time by starting earlier, working later into life or both. Next months informational blog post will focus on the impact and cost of postponing your retirement savings in detail.
Investment Earnings: We don’t directly control the returns we get on our investments (savings) but we do control the amount of risk in our investments (savings). Generally, over time, higher risk results in higher returns. It is crucial that we stay the course, which can be hard in times of stress but not taking enough risk can also be costly. Overly conservative returns may be more secure (less prone to negative results) but they usually are not enough to achieve a desirable outcome.
Analysis:
In order to better understand the impact of the retirement decisions we make, I created a model where we can input a base case scenario and record the results. Then we adjust one thing at a time and see how much it influences the results.
Below is the output of my model. The inputs and the optional sections are things we can adjust, the derived section gives us important outputs and the graph gives us a view of our expected savings pool balance over time (given the parameters). The base case will be an annual income of $100,000, spending of $90,000 (so a savings of $10,000) and earnings on investment of 5%. The savings plan starts at age 25 and needs to fund spending until the person is 101. In this base case they can retire at age 68 and will have just over $1.4 million when they retire. The chart shows how their balance increases and decreases and hits 0 at about age 101. Notice how the curvature changes before and after retirement, this is from the impact of investment returns.


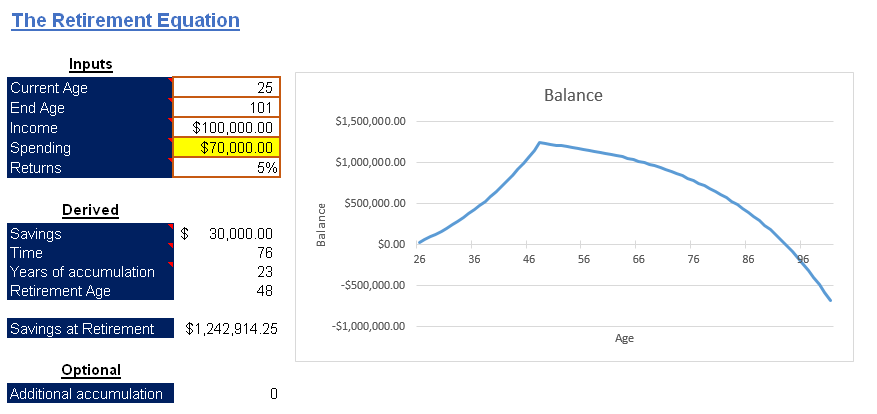
Next let’s look at the impact of reducing our spending by the same $20,000 (to $70,000). This allows us to retire at age 48 (our thrifty living meant we could work 20 years less). This gives us a better result than increasing income (even though the savings rate is increased to $30,000 in both scenarios). The reason for this is because we are spending less in our retirement years and so we are draining our funds more slowly. Look at the savings needed to retire, it is almost $400,000 lower when we reduce spending.
Next, we adjust the returns down to 3% (much more conservative investments). Here we cannot retire until we are 80 (notice much less curvature of the graph). A two percent difference in returns added 12 years of work to our plan.

Finally let's look at the impact of retiring 2 years before we should vs 2 years after we should. Essentially this gives an idea of the impact of time. If we add 2 years we still have over $800,000 at age 101.

If we retire 2 years early we run out of money at about age 92.

I will talk more about the time issue next month.
Something interesting to note in the last two graphs is how the slope of the graphs differ after the retirement date (on the right hand portion of the graphs). By saving a bit longer than needed the accumulated funds go down much slower. This is because our investment returns are larger (due to the larger pool of assets) and offset more of the spending each year. The flatter this line is the more flexibility you will have to handle negative events in your post retirement life.
Conclusions:
To conclude I will sum up all the graphs and numbers into a couple of simple statements.
- Reducing spending is more powerful than increasing income.
- Being too conservative with investments has a high cost.
- Time can be our friend if we get started early.
I would love to hear your thoughts and feedback. If you would like a copy of the spreadsheet I created for this post (so you can put your own numbers in) e-mail a request to btbagg@gmail.com.

Hi Bryan. Great discussion! Any chance of getting a copy of the spreadsheet? Thanks, Dan.
ReplyDelete