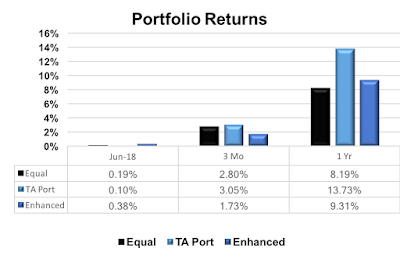
June 2018 performance
COMMENTARY:
Equal Portfolio: This portfolio is invested about 25% in each of four asset classes (investment grade debt AGG (-0.1%), high yield debt JNK (-0.4%), large cap equity VONE (0.1%) and small cap equity VTWO (0.1%)). In June it returned 0.2%. It is the baseline or benchmark against which I judge the other portfolios.
TA portfolio: This portfolio is 100% in large cap US equities VONE (0.1%). So, in June it returned 0.1%.
Enhanced portfolio: This portfolio returned 0.4% in June. global utilities JXI (0.3%), global consumer staples KXI (1.5%), International Equity DSEUX (-0.2%), US equity DSEEX (0.1%), commodities DBCMX (-2.9%).
Color significance:
Red = Small cap equity
Orange = Large cap equity
Purple = High yield debt
Green = Investment grade debtCumulative returns of each of the strategies as though you had invested $100,000 in them at the beginning of the blog.
Peer Relative: Morningstar
How does performance stack up against the other active managers who are trying to run a similar strategy?
As of June 29, 2018 the blog funds percentiles were:
The Peer groups statistics were:
These numbers strengthened during June. For the last year all portfolio's are above 70% of their actively managed peers (anything above 50% is better than average). The TA fund did outstanding at 97% meaning only 3% of active tactical allocation managers performed better over the past year.
Understanding the peer ranking:
Equal, TA, and Enhanced - The % tells where it ranks during that period (100% would be the top performing fund, 0% would be the bottom)
# of Funds - how many funds reported returns during that period
Max and Min - best and worst return reported for that time period
ATTRIBUTION:
How does performance stack up against the other active managers who are trying to run a similar strategy?
As of June 29, 2018 the blog funds percentiles were:
| 1 Mo | 3 Mo | 1 Yr | 3 Yrs | 5 Yrs | |
| Equal | 68% | 91% | 73% | -na- | -na- |
| TA | 63% | 93% | 97% | -na- | -na- |
| Enhanced | 73% | 74% | 79% | -na- | -na- |
| Peer Group | |||||
| # of Funds | 308 | 302 | 289 | 242 | 182 |
| Max | 3.20% | 6.91% | 21.33% | 12.35% | 10.87% |
| Min | -3.24% | -5.09% | -11.31% | -11.98% | -9.23% |
These numbers strengthened during June. For the last year all portfolio's are above 70% of their actively managed peers (anything above 50% is better than average). The TA fund did outstanding at 97% meaning only 3% of active tactical allocation managers performed better over the past year.
Understanding the peer ranking:
Equal, TA, and Enhanced - The % tells where it ranks during that period (100% would be the top performing fund, 0% would be the bottom)
# of Funds - how many funds reported returns during that period
Max and Min - best and worst return reported for that time period
|
The way to think of this is that the "Allocation Rt" is how much the TA portfolio out (or under) performed the equal weighted portfolio (how much did the asset allocation benefit returns). The "Selection Rt" is how much the enhanced portfolio out (or under) performed the TA portfolio (how much security selection benefited returns).
Allocations during June were:
June one year performance (in order): VTWO (17.8%), VONE (14.4%), JNK (0.6%), AGG(-0.5%), KXI (-1.8%).
TA position taken one year ago: VONE
Rank: 2nd
| History | 1st | 2nd | 3rd | 4th |
| Number of Bets: | 0 | 2 | 0 | 0 |
| % of Bets: | 0% | 100% | 0% | 0% |
Enhanced position taken one year ago: KXI
Rank: - (KXI underperformed VONE)
| History | + | - | ||
| Number of Bets: | 0 | 2 | ||
| % of Bets: | 0% | 100% |
DISCLAIMER:
Past performance is not a guarantee of future performance. This strategy is presented for informational purposes only and is not a solicitation to buy or sell any securities. October is one of the peculiarly dangerous months to speculate in stocks in. The others are July, January, September, April, November, May , March, June, December, August and February. ~ Mark Twain


Comments
Post a Comment