Posts

Showing posts from March, 2019

How Does Dollar Cost Averaging Work?

Image
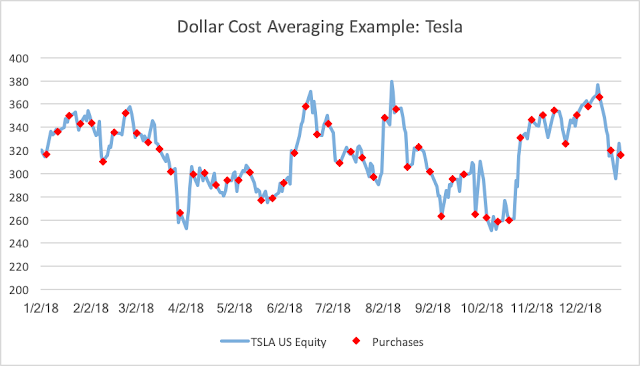
Dollar cost averaging simply means that you buy the same dollar amount of a security at regular intervals. Example: You buy $1000 of Tesla stock every Friday for a year. Why do it?   This is easiest to highlight with a real life example. You buy $1000 of Tesla stock every Friday for 52 weeks. You start on January 5, 2018 when the price was 316.58 You end on January 4, 2019 when the price was 316.13 Was this a profitable investment strategy?   If you had bought on 1/5/18 and sold on 1/4/19 you would have had a small loss because the price was slightly lower.  However because of Dollar Cost Averaging we actually made $560 and had an internal rate of return (IRR) of 2.2%. How is this possible? By holding the dollar amount invested constant we bought more shares when the price was low and less shares when it was high. Example: On February 2nd, when the stock price was $343.75 we only bought 2.91 shares of stock but on October 12th, when the price was $258.78 we bought 3

February 2019 Track Record

Image
Historic Track Record Report Card: A record of all of the completed positions I have taken in the TA and Enhanced portfolios. One year performance as of February 28th (in order):   VTWO (5.5%),    VONE (4.9%) ,   JNK (4.3%) ,   AGG(3.1%) . TA:   Position taken one year ago:  VONE Rank:   2nd History 1st 2nd 3rd 4th Number of Bets:   2  6  2  0  % of Bets:   20%  60%   20%  0 % Enhanced:  Position taken one year ago:  DBCMX (-3.2%) Rank :  - Negative History     +   =   - Number of Bets:     3   1   6 % of Bets:   30%  10%  60% PORTFOLIO UPDATE (as of 3/08/2019): Current Performance: The ETF's and other funds that make up the portfolio's MTD Returns: Ticker 3/8/19 VONE -1.6% VTWO -3.4% JNK -0.7% AGG 0.2% DVY -0.9% IEMG -1.8% KXI 0.2% JXI GOVT 0.6% 0.4% Co lor significance: Red           =   Small cap equity  Orange     =   Large cap equity Purple      =   High yield debt Green       =   Investment

March 1, 2019 Trades

Image
Trades made within the portfolio's on March 1st followed by a listing of the current holdings in each portfolio. Equal Weight Portfolio: Cash balance on March 1st = $25.91 No Trades TA Portfolio: Cash balance on March 1st = $116.67 No Trades Enhanced TA Portfolio: Cash balance on March 1st = $52.87 Sold 844.47 shares of DBCMX at 9.67, with $7 commission = $8,159.02 Bought 83 shares of DVY at $98.23, with $7 commission = $8,160.09 Cash after transaction = $51.80 The Portfolios as of 3/1/2019: Equal Weight Portfolio:   Cash = $25.91 VONE  = 225 Shares VTWO  = 234 Shares AGG  = 244 Shares JNK  = 737 Shares TA Portfolio: Cash = $116.67 VONE   = 775 Shares AGG  = 179 Shares Enhanced TA Portfolio: Cash = $51.80 VONE  = 454 Shares IEMG  = 158 Shares KXI  = 165 Shares JXI  = 184 Shares DVY  = 83 Shares GOVT  =  659 Shares DISCLAIMER: Past performance is not a guarantee of future performance.  This strategy is